
Name: Gilmore City
Location: Near Gilmore City in :Pocahontas County, Iowa (Figure 1). It is in the Garfield Township at SW1/4, Section 27, T92N, and R31W.
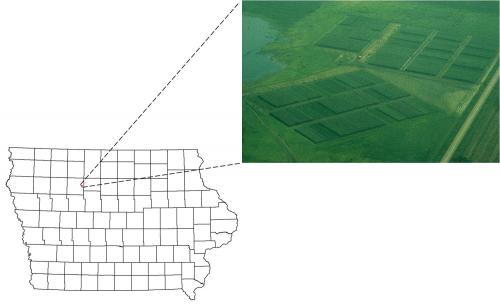
Figure 1: Gilmore City site
Description: The total area is 4.5 ha, of which 3.8 ha are used as experimental plots and the remainder as border and buffer. A total of 72 experimental plots are available with 0.05 ha (15 x 38m) each.
Background: The research conducted at the Gilmore City site tracks how cropping practices and nitrogen management practices affect nitrate loss and crop yield. This site carries over 20 years of history of water quality work and research. Due to changing treatments in 2010, we consider 2010 as a transition year and as such have three years of data collection from 2011, 2012 and 2013. We will continue data collection in 2014. This will allow a full four-year data set to quantify the environmental and crop yield impacts of these systems. Project staff manages all field activities at the Gilmore City plots.
Soils: Nicollet, Webster and Canisteo clay loams with 3-5% organic matter.
Drainage Design: In 1988 the site was instrumented for replicated studies of drainage water quality. Drainage lines run the long dimension through the center of each plot and on the borders between plots (7.6 m space). Twenty-six aluminum culverts were buried at the terminus of drainage lines from three individual plots (78 total plots) to accommodate a water table dewatering sump and three sampling/monitoring systems. Drainage lines from individual plots were directed to separate sumps within the culvert. Drainage water is pumped through plastic plumbing fitted with a common plated sprayer orifice nozzle and a water meter. Back pressure created by the meter forces a small constant fraction of all drainage to be diverted to a glass sampling bottle so tha ta flow-proportional water sample is collected.
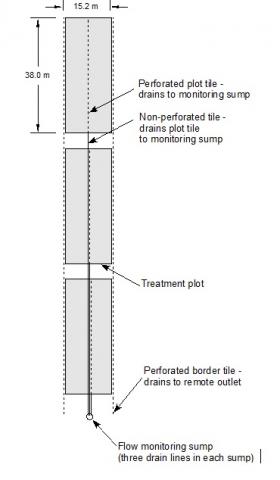
Figure 2: Plot drainage design
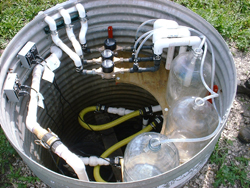
Figure 3: Gilmore City monitoring sump
Treatments:
Table 1. Treatments at Gilmore City (2010-2014)
|
Treatment Number |
Tillage |
Cover Crop |
Nitrogen Application Time |
Nitrogen Application Rate (lb/acre)* |
Drainage NO3-N (mg/L) |
|||
|---|---|---|---|---|---|---|---|---|
|
|
|
|
|
|
2010 Corn |
2010 Soybean |
2011 Corn |
2011 Soybean |
|
1 |
Conventional tillage |
_ |
Fall (Aqua-Ammonia) |
150 |
13.0 |
10.3 |
11.6 |
10.0 |
|
2 |
Conventional tillage |
_ |
Spring (Urea) |
150 |
13.1 |
11.4 |
11.7 |
12.0 |
|
3 |
Conventional tillage |
_ |
Spring (Aqua-Ammonia) |
150 |
14.8 |
22.7 |
15.5 |
12.6 |
|
4 |
Conventional tillage |
Winter rye cover crop |
Spring (Aqua-Ammonia) |
150 |
11.1 |
11.8 |
8.4 |
9.3 |
|
5 |
No-till |
_ |
Spring (Aqua-Ammonia) |
150 |
13.4 |
10.8 |
9.8 |
10.8 |
|
6 |
No-till |
Winter rye cover crop |
Spring (Aqua-Ammonia) |
150 |
11.0 |
11.0 |
8.7 |
8.8 |
|
7 |
Conventional |
_ |
Spring – Poly coated urea |
150 |
11.9 |
15.4 |
11.6 |
10.5 |
|
8 |
Conventional |
_ |
Late season side-dress |
150 |
11.9 |
14.1 |
9.0 |
11.7 |
|
9 |
Kura clover – Corn* |
|
- |
150 |
9.0 |
/ |
8.3 |
/ |
|
10 |
Orchard grass + Red/Ladino clover |
|
- |
no fertilizer |
1.9 |
2.4 |
||
* For corn plots only